
Start with your favourite genes and design new probe-sets in our Panel Design Studio to create your own custom panel ‐ perfectly suited to answer your biological reaseach question.
For human samples, we provide a target selection guide to quickly identify markers for cell-typing applications, backed by data obtained from the The Human Protein Atlas.
Create virtual heatmaps for your panel showing theoretical expression levels of genes across various human tissues and cell-types to fine-tune your selection.
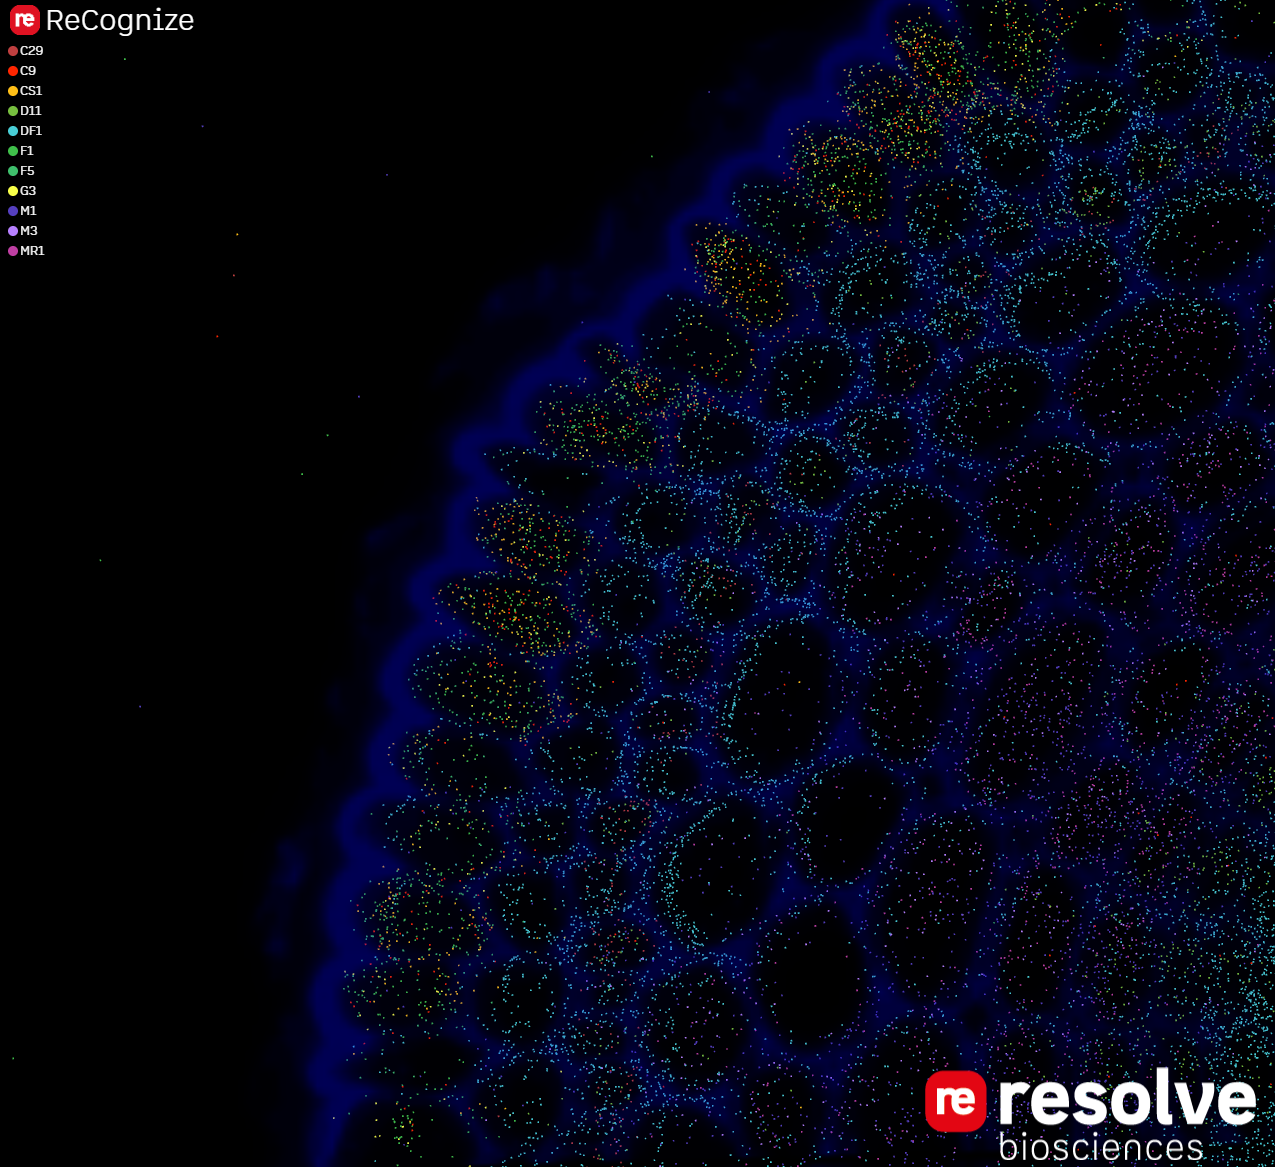
Explore gene expression in three dimensions.
Render transcripts in your sample's context!
In the full version, you can add images (DAPI-stained nuclei, any other post-staining method) and navigate through your sample to match morphology and molecular biology - online.
ReCognize - Our all-in-one Solution
Launch the application below.
Navigation is done directly using the mouse (or trackpad).
Hold the left mouse button and drag/move to adjust camera position
and hold the right mouse button and drag/move to rotate.
Scroll the mouse-wheel up to zoom in, or scroll it down to zoom out.
Alternatively, the magnification can be adjusted by clicking the respective buttons.
Please refer to our User Guide to learn how to use all the features!
Please select a ROI set to display.
ROI sets can be added in the file manager.
Please select an image set to display.
Image can be uploaded in the file manager.
Record screen and export as movie file
Compare cells by function and location.
Perform cell-clustering running Seurat in our cloud backend, directly from your browser!
In the full version you can adjust parameters like mininmal number of transcripts, number of dimensions to use, or subset the input to only consider selected genes for clustering.
Plot cells according to their UMAP coordinates in three dimensions!
Using three dimensions of the Uniform Manifold Approximation and Projection (UMAP) makes it much easier to identify and mark groups of interest. Selected cells will be highlighted in the main visualization to quickly compare functional and spatial relationships.
Compare gene expression across clusters to get a quick yet comprehensive overview!