You can launch the ReCognize application from the Filemanager on the portal. The filemanager can be found in the menu Data & Analysis (in section headed Data Management), and the menu entry is called Molecular Cartography Data.
Every dataset (row) that is ready for visualization will have a green 3D button (see below) in the column labeled Action on the right. A red icon indicates that the dataset is still being prepared and not yet ready for visualization. An example of a dataset ready for visualization is shown below.
| Filename | Size [MB] | Source | Description | Access | Action |
|---|---|---|---|---|---|
| Rice Root | 2.234 | upload | Demo Data | public | 3d_rotation |
| Filter Genes | Min Cells | Filter genes by the minimum number of cells/ROIs expressing it range:1 - 500 |
| Filter Cells | Min Features | Filter cells by minimum number of different genes expressed range:1 - 50 |
| Min Transcripts | Filter cells by minimum total number of transcripts range:1 - 100 |
|
| Clustering Parameters | Dimension | Number of PCA dimensions |
| Resolution | Clustering Resolution | |
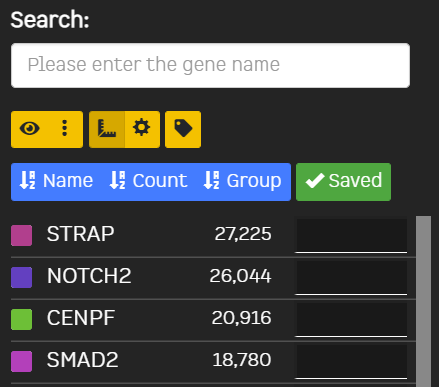
| Genes | Use only currently selected genes |
Press this button to download a zip file with the results of the latest celltype clustering. The zip file contains: